
As explored in one of our previous articles, tracking metrics is a crucial component of a successful development system. But how can you leverage those metrics further? The solution is quite simple: with the trace reporting function available in Windchill Requirements, Validation & Source (RV&S), formerly known as PTC Integrity Lifecycle Manager!
In the example below, we will walk through the steps of building a simple, backtrace report. Traceability metrics within these reports ensure content items from various documents track and source properly. In fact, one of the best features of Windchill RV&S (PTC Integrity) is the ability to thoroughly count backtraces!
What is the purpose of a Windchill RV&S (PTC Integrity) Reporting?
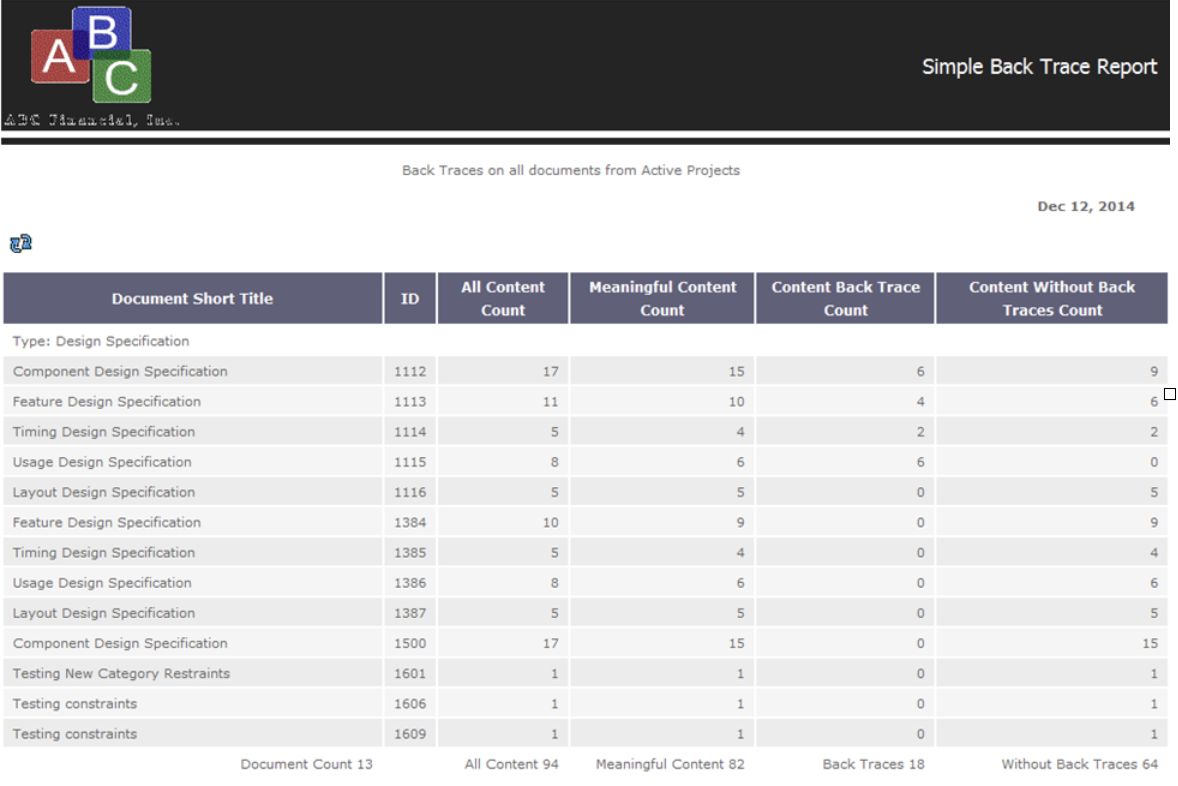
This report performs the following activities:
- A query on the database to retrieve all of the relevant document items
- Groups those results by Item type
- Provides totals for each group of documents
For example, in the above screenshot, we can see 13 Design Specification documents, as well as the totals for all the various content metrics.
How do you build this report in Windchill RV&S (PTC Integrity)?
You can create this report with the support of the PTC Integrity Report wizard.
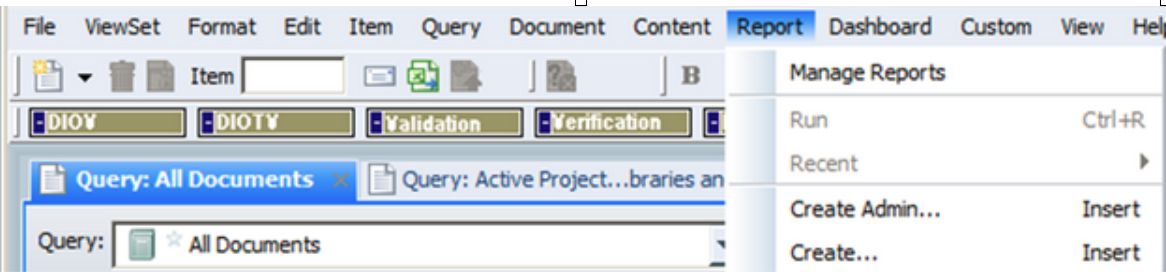
From the Report menu in your Windchill RV&S, select “Create…” If the Report menu or the “Create…” option does not exist, you may have to customize your ViewSet to make it visible. Only use the “Create Admin…” option if you are a member of the Administrator group, and hope to build a system-supported report for use across your team. In this example, the report is for individual use — or for sharing with one colleague.
Type
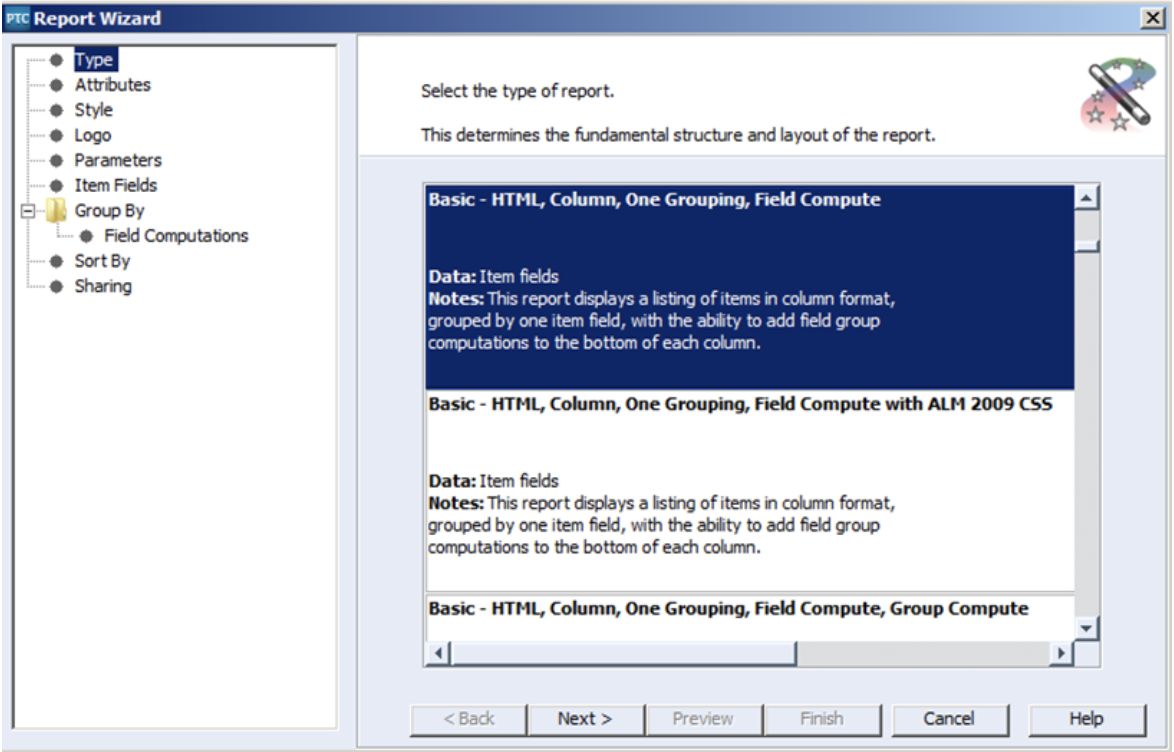
After you hit “Create…” the Windchill RV&S (PTC Integrity) Report Wizard will open. When creating a new report, first select the ‘Type’ of report you want to produce. These types are called Report Recipes. In this example, we select the “Basic – HTML, Column, One Grouping, Field Compute”
Attributes
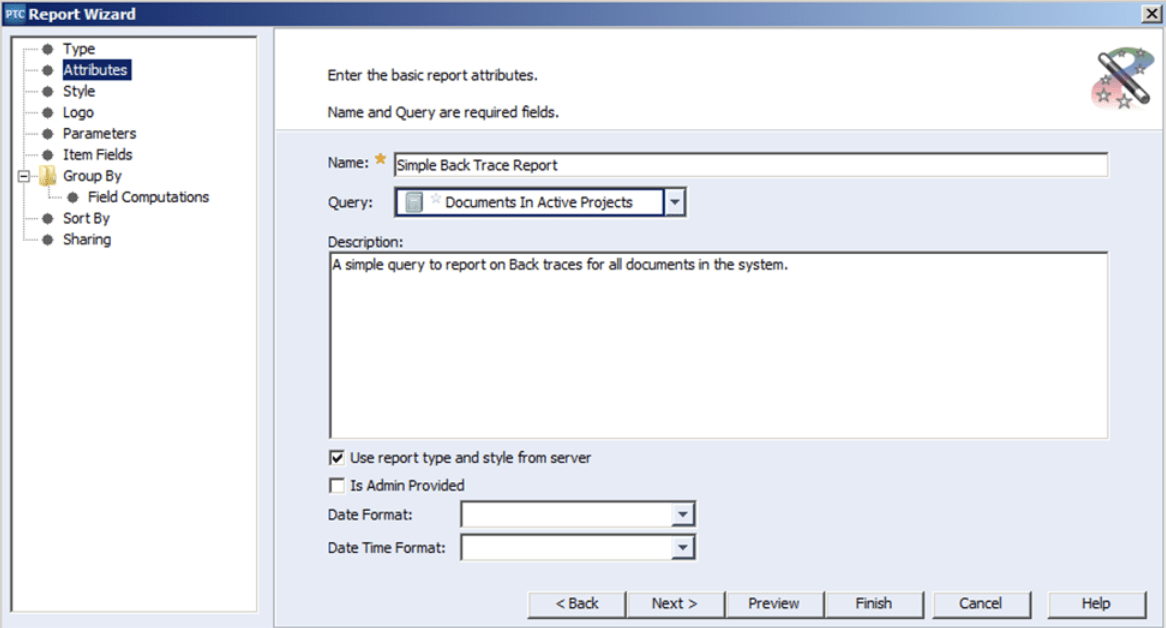
After selecting the “Next >” button, fill in attributes like a Name for the Report, the query you want to base your report on. In this example, we use the admin-provided query: “Documents In Active Projects,” and a simple description. Do not fill in the “Is Admin Provided” checkbox, unless you belong to the administrator group.
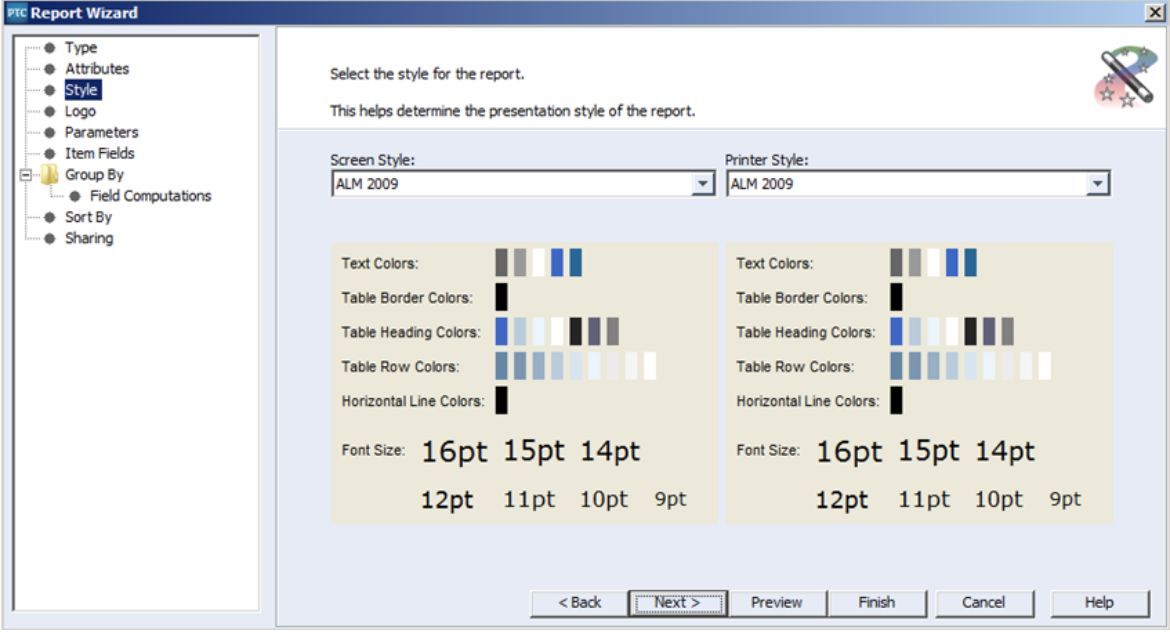
Style
On the Next panel, select the style that will apply to the HTML report. There are several basic styles available for your convenience. In this example, we selected ALM 2009 for both the screen display and the physical copy.
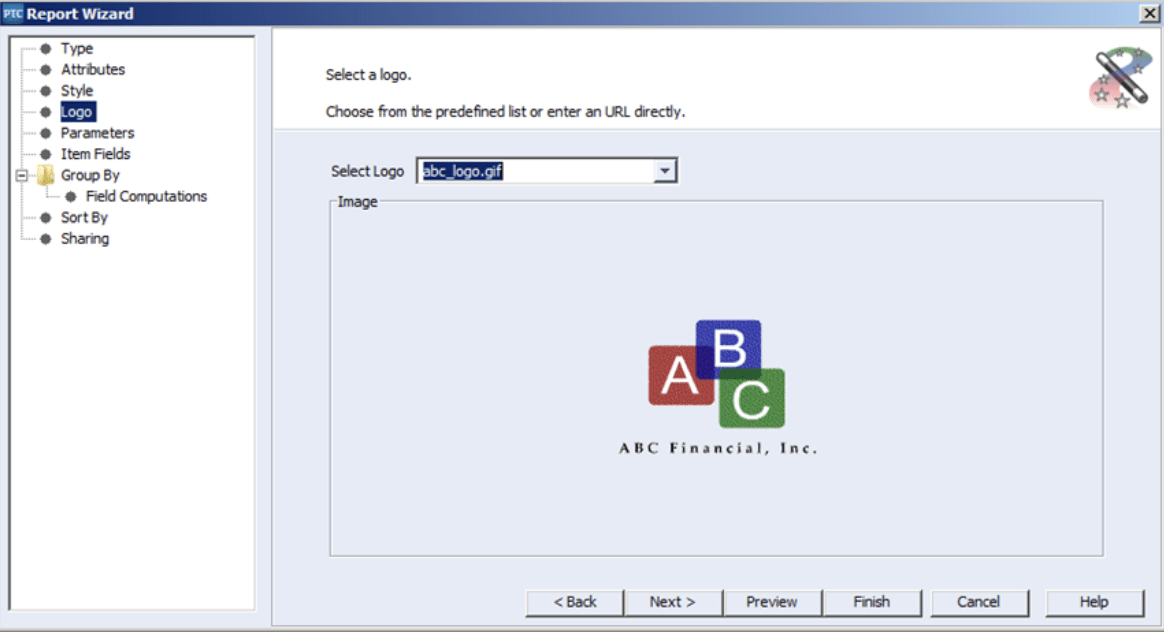
Logo
In the next panel, select an image to serve as a logo for your report. Have the image stored on your server beforehand.
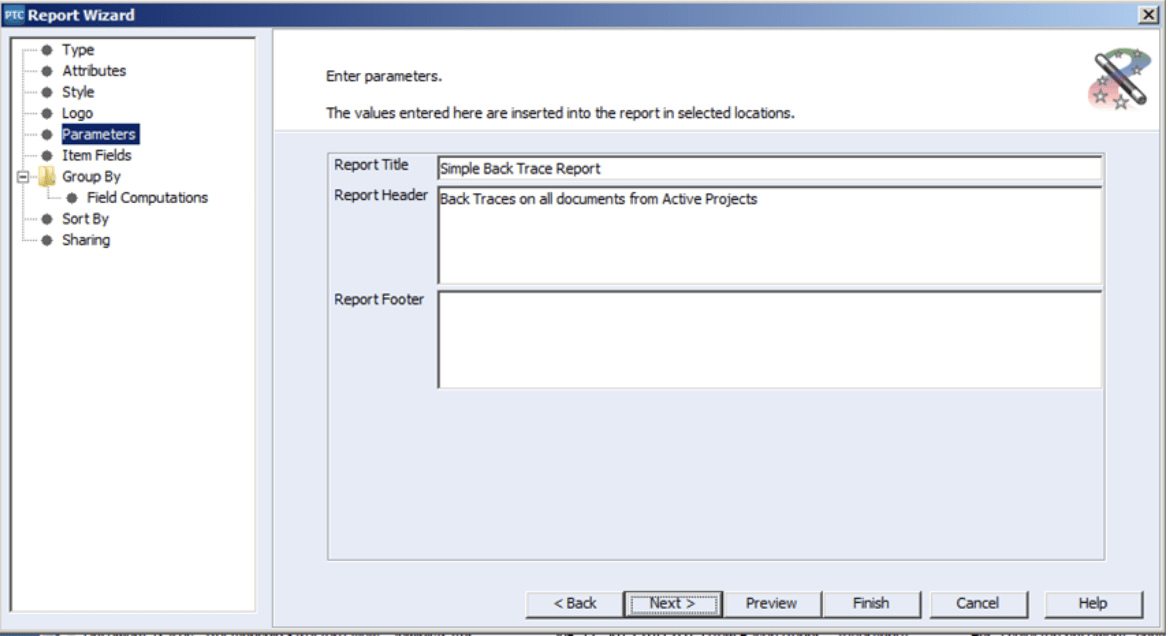
Parameters
Next you can set up a title, a header and a footer that will display on your report:
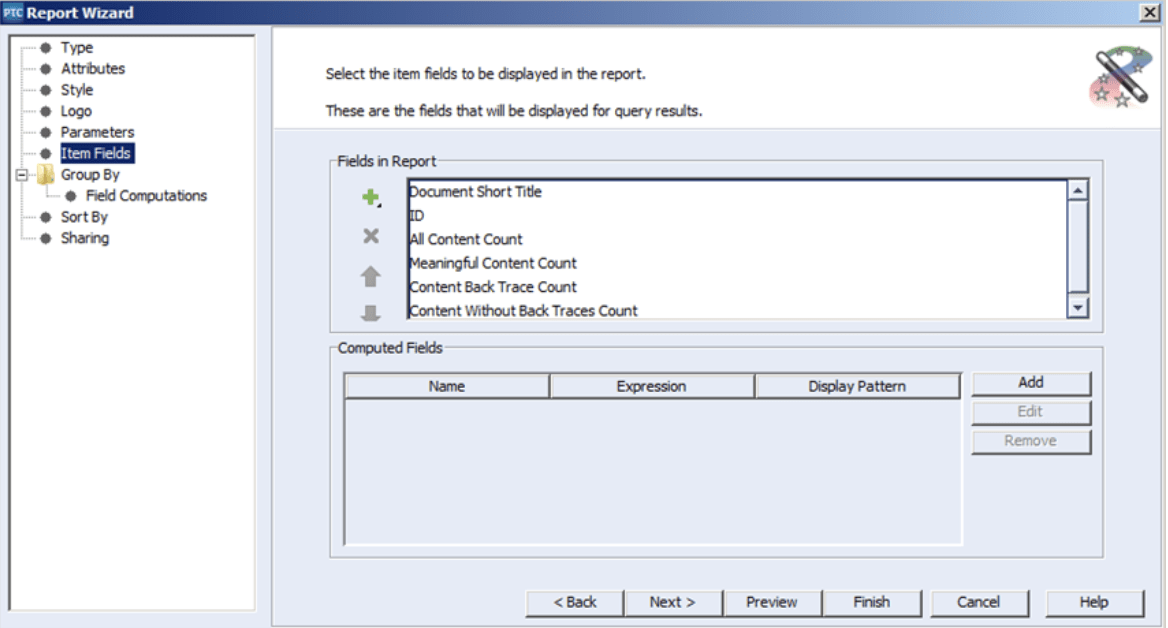
Item Fields
After that, select the fields you need in the report, as shown below:
The “group by” option will pair all results returned from the query by the values of the field specified in the Group By field. Within this example, we will group the results per the Type field.
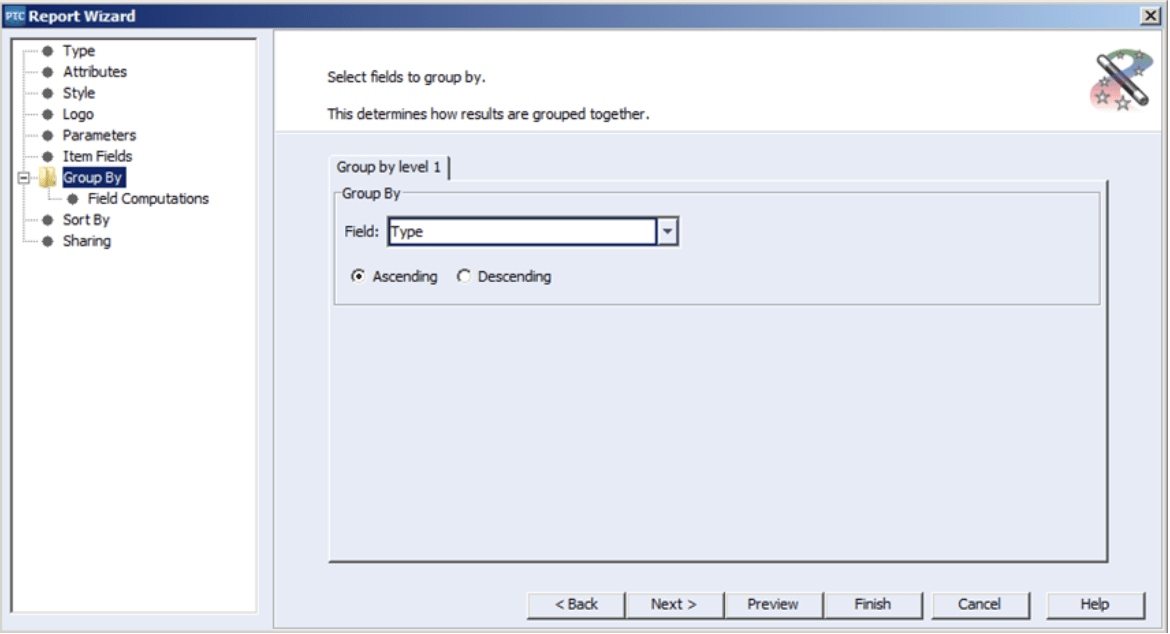
Since our specified query will only return document items, the values for Type feature restricted options like “Design Specification,” “Requirements Specification,” and “User Needs”. Thus, the report will organize such that all returned “Design Specifications” sort together, all “Requirement Specifications” sort together, and all “User Needs” sort together.
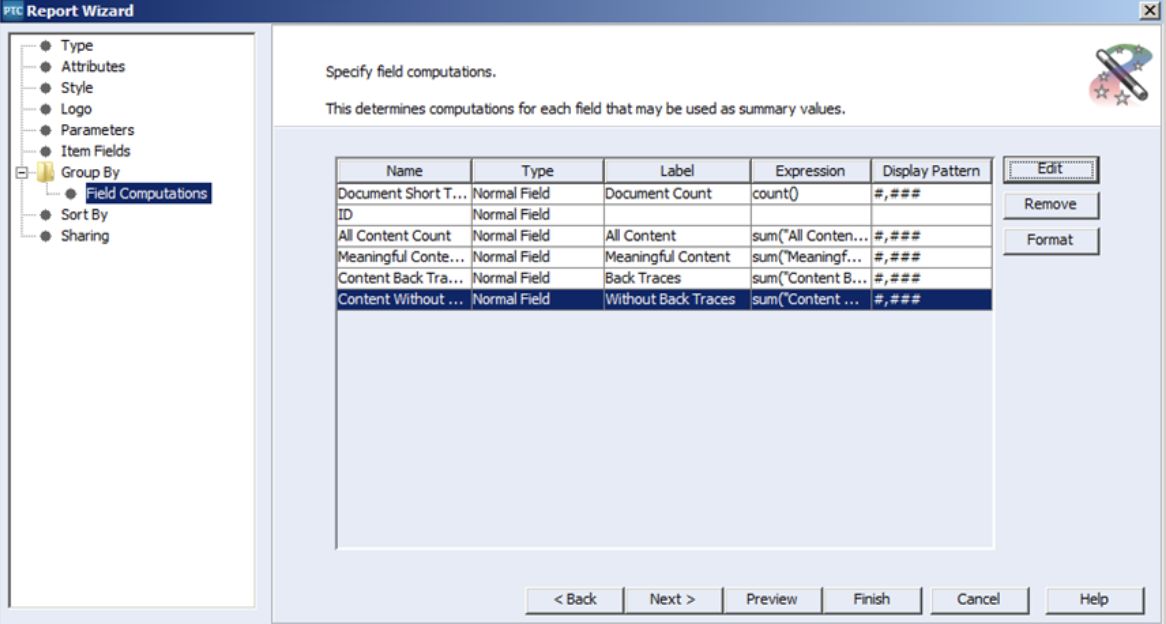
On the next panel, you can perform computations on each column of data within each grouping.
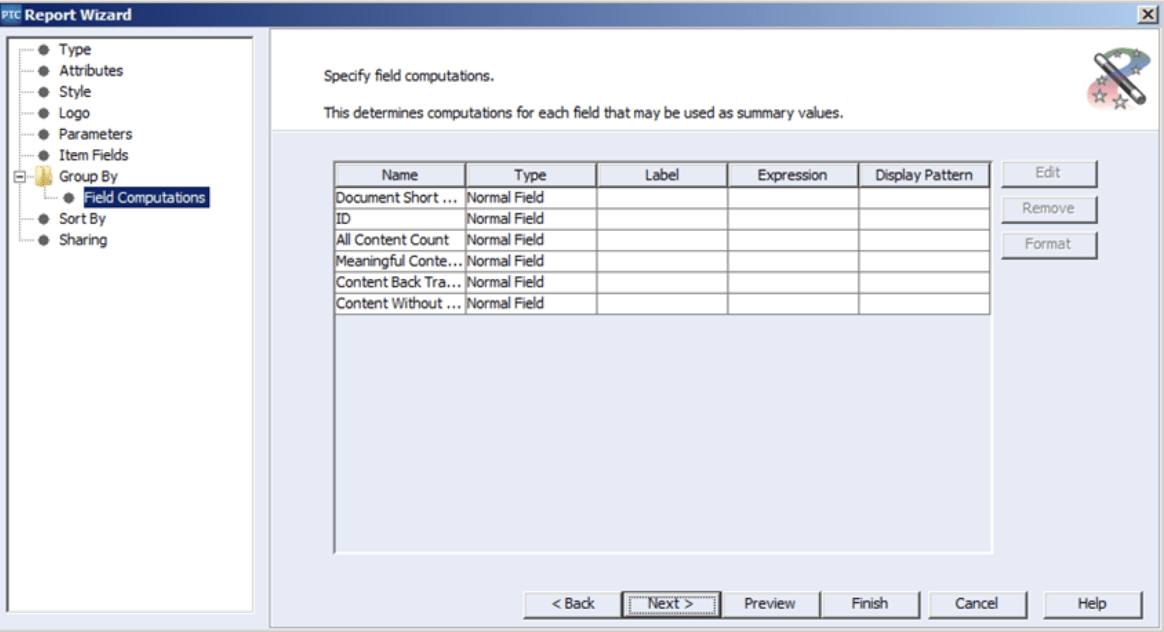
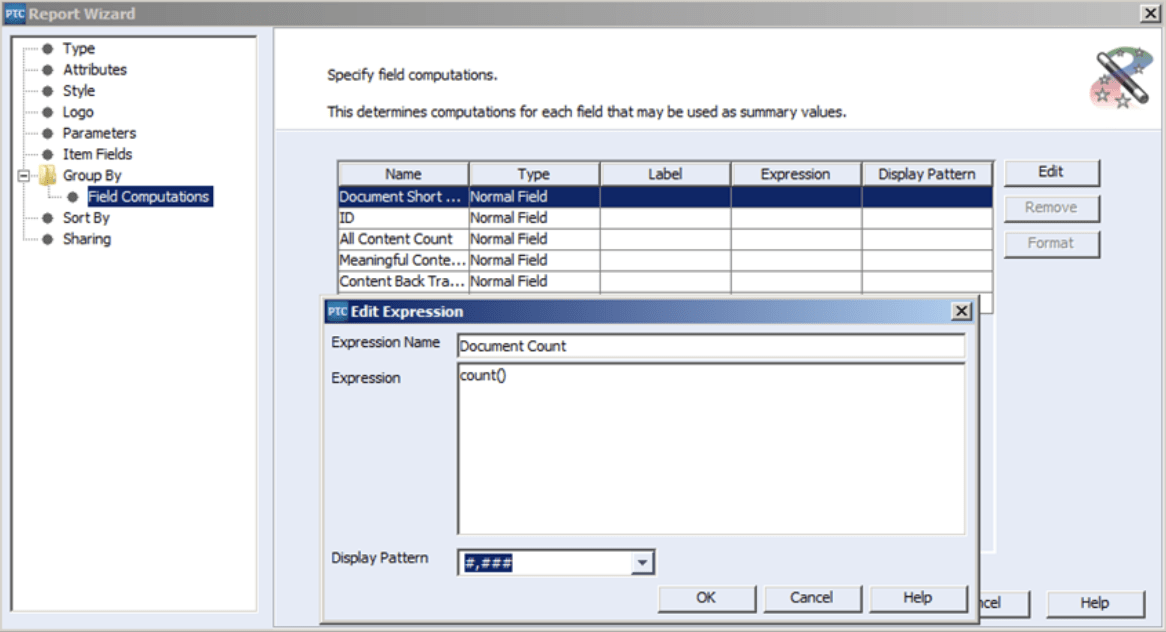
For the first computation, we will count all of the “Document Short Titles”. First, select the line with Document Short Title, and then select the edit button. This will open the Edit Expression dialog, where we can name the expression, set up the computation, and set a display pattern for the resulting integer.
Next, we want to add up all of the integers in the All Content Count column. Use the “sum()” function to add up all the values in the named field.
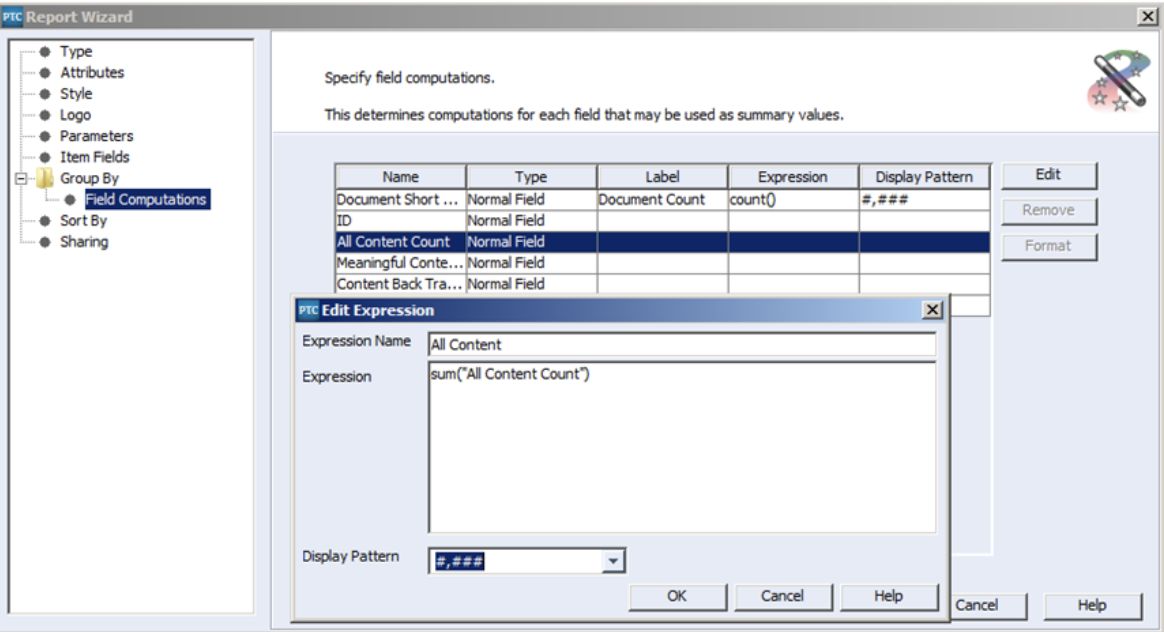
Similarly, we can use the sum function to create totals for each of the columns, “Meaningful Content Count,” “Content Back Trace Count” and “Content Without Back Traces Count.”
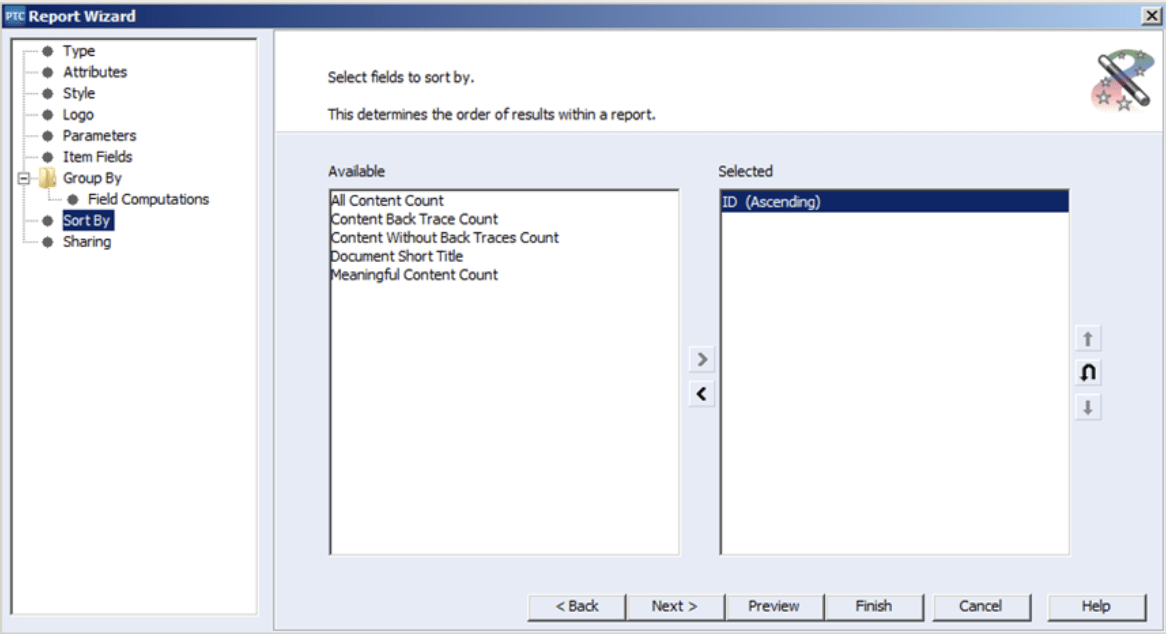
Sort By
Next comes the “Sort By” panel. Since this report groups the major items together already, sorting is less critical. In this case, I simply sorted the items by their IDs.
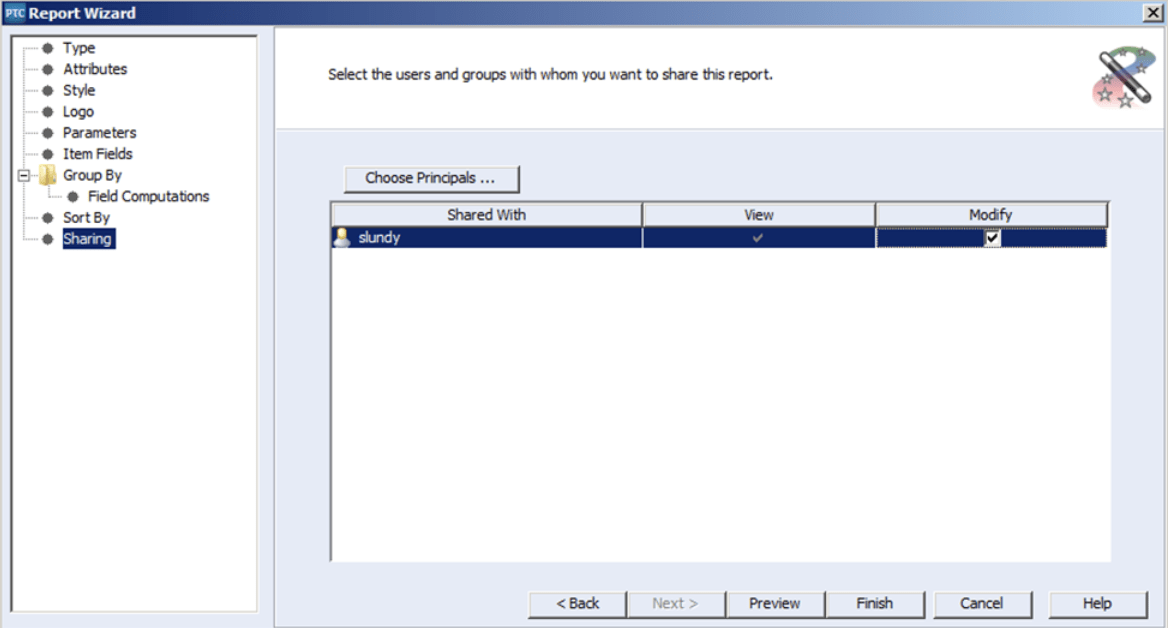
Sharing
The final panel is the ‘Report Sharing’ panel. Using the ‘Choose Principals’ button, you can share your new report with specific individuals and/or groups throughout your organization. You can even delegate individual permissions to make changes to the report. For the sake of this example, I only shared the report with myself!
In conclusion, this example report is one look into the capabilities of reporting within Windchill RV&S (PTC Integrity). In this case, the ability to report on properly traced items or documents within Windchill RV&S (PTC Integrity) will help you determine your next steps in your product delivery cycle!
Next Steps
- Contact SPK and Associates to discuss and identify how we can help your engineers with navigation, automation, and efficiency within Windchill RV&S (PTC Integrity).
- Read our White Papers & Case Studies for examples of how SPK devises accessible, unique solutions, as well as the options within Windchill RV&S (PTC Integrity) for further productivity.
- Subscribe to our blog to stay informed on product development and engineering efficiency topics.