CloudBees SDA Analytics has more power than you think
One of the main features of CloudBees SDA is CloudBees Analytics, powered by ElasticSearch. It’s a powerful tool for displaying continuous integration data and there are loads of useful metrics available from extensive dashboards right out of the box.
Why should I bother extending to CloudBees Analytics?
The CloudBees analytics platform is powerful and useful right away, but depending on your local system you may want to pull data from more sources than just the ones in SDA. The CloudBees analytics system only has access to data within SDA itself. If it makes sense to get data from a 3rd party tool, it needs to be set up before that data can be displayed.
For example, a client I worked with wanted to display lead time on the CloudBees analytics dashboard. While SDA does have a built-in dashboard for lead time, this differed from how the client wanted to define it. Not a problem, we had the tools to make that happen. The first step was pulling in data into the pipeline they were running. In this case, we needed the creation date for Jira tickets. Once we had the data in our local system, we could use it in reports.
Two ways to get custom data into dashboards
There are two main ways to get custom data into reports: output parameters, and extending the Elasticsearch database. Of the two, output parameters are easier to work with but they are limited to only passing strings. This means that once you get data to the report end, it needs to be cast to whatever data type the dashboard requires.
Extending the Elasticsearch database is more challenging. But, if you know you’ll be passing the same types of data over and over again, it may make sense to permanently update the data types available in your reports. This feature allows you to add custom fields of any data type and fully control how they’re implemented. It’s more complex, but more extensible for those brave enough to dig in.
Output parameters
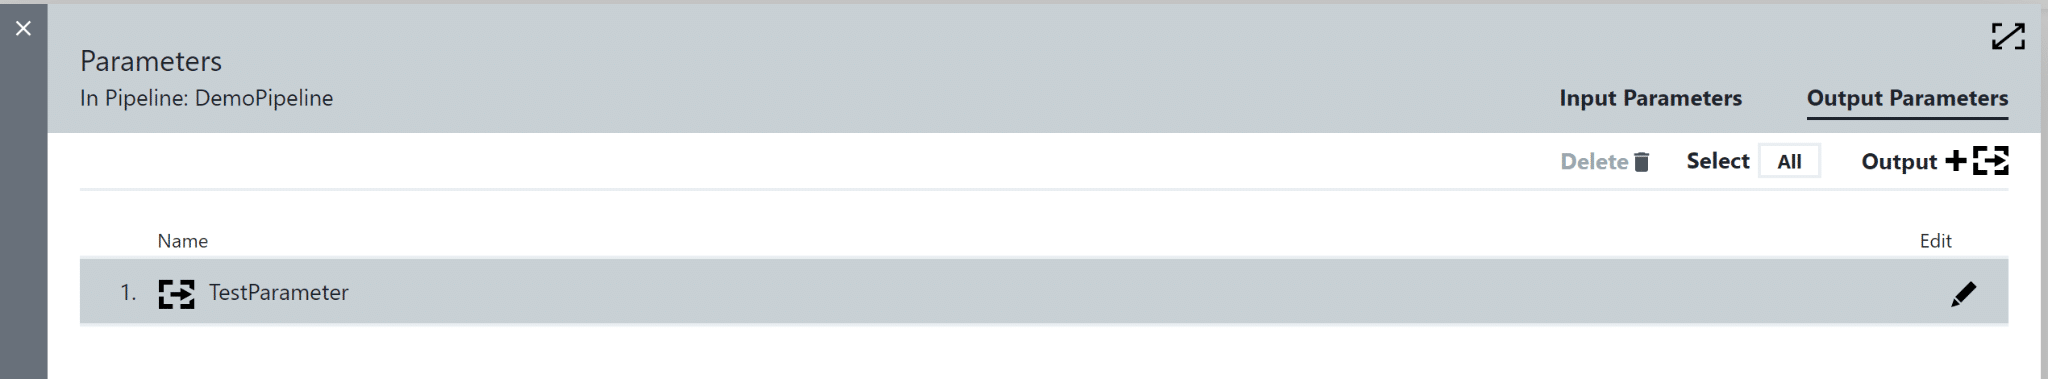
Setting up an output parameter is a simple matter in the SDA UI. From any pipeline, select the menu in the upper right and go to “Parameters”. Once in the selection UI, click on “Output Parameters” in the upper right and you can add as many as you like. Output parameters will not have any data by default and are limited to only strings. Keep in mind that they will only show up in reports once you run a pipeline that passes some data into the parameter.
Once any data has been run in a pipeline with an output parameter, it will show up in the reports. Create a new report and select the “Pipeline Run Report” type. From there, the quickest way to ensure the parameter exists and is being displayed correctly is to enter a new search criterion for “Output Parameter: <my parameter>”. As with other data, once you have the system set up, you can save the report and check the tabular preview” to view your data.
Adding more attributes to the database
This method is more complex but offers full control of how data is stored and used for analytics. Setting this up is a two-step process:
- Create the new database entries.
- Send in data to match the new configuration.
For the first step, navigate to “<SDA install location>/bin” and run this command:
~ ectool createReportObjectAttribute <report object type> <attribute name>
You’ll need to replace “report object type” with the type of report you want to associate with (for example, “pipelines” or “quality”) and the attribute name with the attribute you want to add. You can optionally add a required data type at the end with the flag –type <data type>, such as –type number. By default, this is set to string.
After that is set, you can send data to this report attribute at any time using this command:
ectool sendReportingData <report object type> '{"<attribute 1>": <data>, "<attribute 2>": <data>}'
Attributes are comma-separated, and you can put in as many as you’d like. My recommendation for pipeline report type data is to send in the pipeline runtime name, ID, and project to keep things consistent and be able to call back if necessary.
Here is an example of a command sending in reporting data to custom fields that have already been set up:
./ectool sendReportingData pipeline '{"successfulTests": $[/success], "failedTests": $[failed], "totalTests": $[total], "flowRuntimeName": $[/myPipelineRuntime/flowRuntimeName], "flowRuntimeId": $[/myPipelineRuntime/flowRuntimeId], "projectName": $[/myPipeline/projectName]}'
Bringing it all together
From there, this data is available immediately in the ES analytics database. Data entries that have been manually set up using the attributes method will be available with whatever name you used. And, output parameters will be prepended with “Output Parameter” to identify them. From there, all of this data can be sent into dashboards and built out normally.
If you’re interested in learning more about CloudBees, check out some of our other CI/CD blogs and case studies on our Resources page. Or, contact me if you have questions!