
How To Use Power BI for KPIs in a Service Enterprise
There are many important Key Performance Indicators to consider when running your business. Measuring your sales growth and the profitability of your projects help you continue to scale and expand. But how do you measure the profitability of your employees in a services-based company? Depending on your time tracking and billing software, you can see how many hours they are working or how much they bill. But do you compare two employees with different bill rates? Are they equally profitable? Are they being fully utilized? Simple comparisons are not apples to apples.
BPAH: An Essential KPI for Service Enterprise
One essential employee metric to consider is Billable Percentage of Available Hours (BPAH). This key metric allows you to clearly compare multiple employees of different labor classes. The formula for BPAH uses simple data points that most time tracking/billing software provides: Billed Revenue and Employee Billing Rate.
Revenue / Billing Rate / Available Hours
This powerful formula provides you with a percentage that shows you how billable an employee is, considering the available work hours. Now you can easily compare two employees with different billing rates. Often, it appears that your more expensive employee is bringing in more revenue. However, they may not be as profitable as an employee that has lower overhead and lower billing rate.
This metric is extremely powerful for making business decisions. However, if it lives in a spreadsheet or needs to be manually calculated each month, it may not be fully utilized by your management team. A data visualization application, such as Microsoft’s Power BI, can help you bring this metric to life in a beautiful, automated dashboard. But how do you use Power BI effectively to show this? Find out how to create this useful dashboard below.
How to Use Power BI to Build a BPAH Dashboard
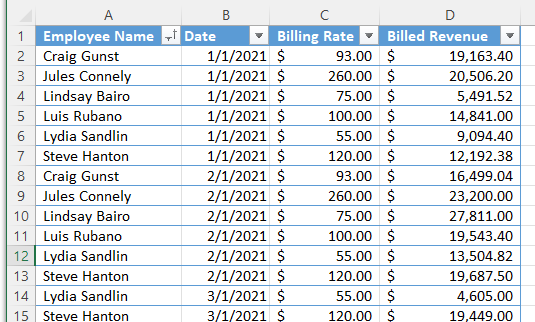
Generate a report from your billing software that includes dates, employee names, billing rates and billed revenue.
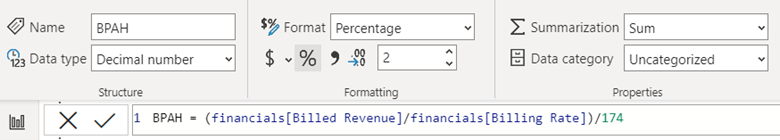
Import your data into Power BI and create a calculated column for your BPAH calculation.
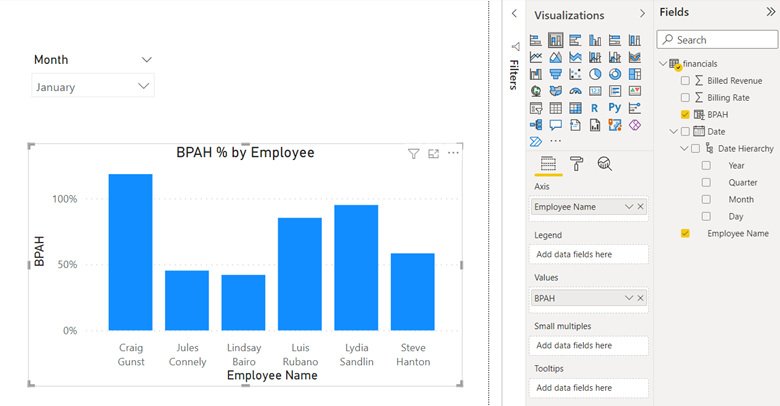
To create a meaningful visualization of your new metric, make a simple column graph that allows you to compare each of your employees by month.
If you have any Data Advisory, Data Engineering, or Analytics questions, we’d be happy to hop on a call to see if we can help.