
Everyone knows that troubleshooting “slow performance” is one of the most challenging tasks we have as IT services providers, but is also one of the best ways to improve productivity (and morale!). Although replacing hardware and buying more expensive computers can help resolve the issue, there are ways to troubleshoot deeper that you may not have considered.
One of the best tools to have available is the Microsoft Sysinternals Process Monitor – procmon.exe. It’s a free tool written by a Microsoft-owned studio. It’s a little bit old, but it still works great, even in Windows 8. It displays all system calls made by every application running in Windows allowing you to see which files are being opened, what network calls are made, and what registry entries are being read.
After you download the file, you’ll be able to run it without any installation. The first thing you’ll be prompted for is the “Process Monitor Filter”. (Older versions of Procmon require you to use the Filter->Filter menu, or the Filter button on the toolbar.)
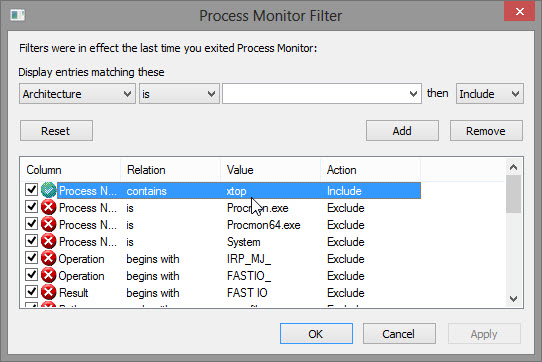
The filter allows you to reduce the data to find what is relevant. When troubleshooting an application, add a new “Include” entry for the process name – in this case, if “Process Name” contains “xtop.exe” then “Include” it in the display.

The Process Monitor window will scroll through all of the actions that xtop performs, with details on file names and registry locations. Additionally, I add two columns: Duration and Event Class.
From here, you may be able to deduce a lot of information, e.g. a program that fails to load might have “NAME NOT FOUND” or “PATH NOT FOUND” results when opening a file. This is extremely helpful for identifying where a Serial Number is being stored in the Registry or where User Settings are being read from disk. When we’re troubleshooting performance, however, we need to simplify the output for our consumption.
There’s an option in the File menu to output the currently-filtered list to a CSV file.
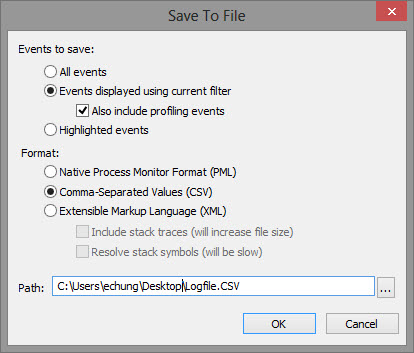
I was able to open the CSV file with Excel. Using very general “spreadsheet tools”, I was able to sort the list by filename and use the Duration column to identify where my pain-points are.
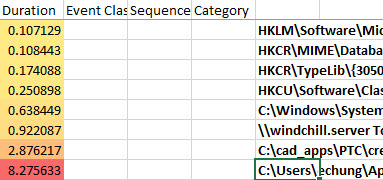
In this case, I’ve identified that 50% of my processing time is spent loading the Windchill Cache files from my User Directory and 20% of my time is spent waiting for the Creo application. Only 6% of my time is spent waiting for the Windchill Server, so I’m more confident that the problem is local to my computer.
Next time, we’ll talk about analyzing network traffic to find where your Oracle Agile and Dassault ENOVIA applications are being hindered!
Next Steps:
- Contact SPK and Associates to see how we can help your organization with our ALM, PLM, and Engineering Tools Support services.
- Read our White Papers & Case Studies for examples of how SPK leverages technology to advance engineering and business for our clients.
Edwin Chung
Client Program Manager, SPK & Associates